Whether you sign up as a member or chose to publish your own work here, we are happy you picked us.
Joining GeekyCorner is quick, easy, and best of all, free – no credit card is needed to create your account!
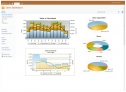
Fusion Charts
Impressive data visualization tools
4 comments

Pallav Nadhani is the Co-founder & CEO of FusionCharts, which provides delightful JavaScript charts, and data visualization tools for enterprises.
We invited Pallav to GeekyCorner to hear his inspiring journey of how from working at his dad's web design/development firm he built a multi million dollar company with over 21,000 customers at the young age of 17 back in 2002.
I see FusionCharts has received numerous awards - from Bestselling Product Awards to Deloitte Technology Fast 500. Today you can add another one to your collection -we at GeekyCorner liked FusionCharts so much that we made it into an Editor’s choice product on our website. So, tell us a little bit more about this great product of yours and how you started out as a company when you were only 17.
FusionCharts started out of the most unlikely circumstances. Not only was I 17, and still in high school, India was not known to produce tech startups back then, let alone one from a technologically slower city like Kolkata. This being the backdrop, it all happened with a need for pocket money, and an article that I wrote for ASPToday.com to make a few extra bucks. The article about ‘Interactive business data-visualization using Macromedia Flash’ became popular. In fact, so popular that I got responses from readers saying they’d pay for customizations on top of what I had built. It still didn’t strike me that there was more than pocket money to be made here, until a lot of readers paid me for customizations or extensions to what I had already built.
Can FusionCharts be described in less than 50 words?
FusionCharts Suite XT is a JavaScript charting library that transforms bland data to delightful visualizations in your business dashboards. Being a pioneer in the industry, we promise JavaScript charts for the grown-ups.
Wow, great job in only 32 words- now can you convince the reader to start using your product in one sentence?
You can get your first chart up in 15 minutes flat!
.png)
If the Internet had not existed – what do you think you would be doing?
Probably, I would have been an accountant.
What is the best advice you have ever been given?
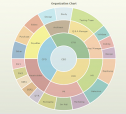
When building an effective organization, delegate everything that you can, so that every single morning when you reach the office, you start to think “What can I do today?”
That’s great advice! You’ve also co-authored a 90-page casebook called "Not Just Another Pie in the Sky". Do you have any other favorite business or related books that you can recommend to other entrepreneurs?
Losing my Virginity -Richard Branson
Screw it, let’s do it -Richard Branson
Rules for Revolutionaries - Guy Kawasaki
If you were to start again, what might you do differently?
Be more aggressive in sales & marketing, from the word go. Delegate early and effectively.
What do you consider the best opportunity / language for young web developers to be getting involved in right now?
Today, businesses of all sizes depend on data to function at every level. This opens up a big opportunity for developers to understand the basic principles of data visualization, and use these principles to make their product dashboards more actionable and insightful to their end users - be it CIOs, Business Analysts, or consumers. I speak on this topic often, and have even shared one of these slide decks on SlideShare.
Editor's note: (Pallav is a guest speaker in numerous tech events and conferences throughout India)
What are you most excited about at the moment?
The future of data visualization in a technology paradigm that is changing so fast.
Lastly, did you ever end up naming "the Dude" - your cartoon mascot that represents FusionCharts?
No, we came close to it a couple of times, but found it more convenient, and familiar to just stick with ‘the dude’.

About the Author
Irina Georgieva
- Irina currently works as a Chief Editor for GeekyCorner after having previously worked over 10 years in IT and Marketing across a number of industries, including mortgage, electronics, and software. She enjoys spending time with her family and is an avid fan of salsa.
Review:

April 03, 2014
InOut CareerLamp
The easy way to start your own recruitment website!
Interview:

September 20, 2013
Aldo Briano,
Yiftee™
Yiftee™
Reviews & Comments:
No comments
Have your say
About Pallav Nadhani
2002
FusionCharts
CEO of FusionCharts
About the Company

FusionCharts
Products listed by FusionCharts
Latest Interviews:

Georgi Dyankov,

Lance Brown,
Latest Reviews
The days that having a website to showcase your cars inventory was something new and edgy have ...
Setting up a dating website can be a great way to start or improve your online business. However, if ...